
雅思写作Task1小作文柱状图范文--不同国家选用手机和座机的人数
- 来源: 未知
- 发布时间: 2016-08-22 16:40
- 责编: 好留学网
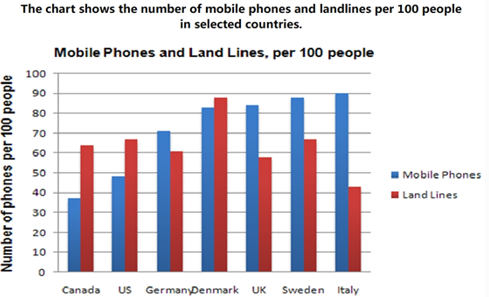
Task:The number of mobile phones and landlines per 100 people in selected countries.
思路解析:
1. 采用对比模式,重点进行组内数据的比较,如加法,减法和除法。
2. 注意重点数据的描述(Max, Min, 最大差异)。
3. 分段原则为: 手机比座机多的国家在一段,座机比手机多的国家在一段。
参考范文:
The graph shows the number of mobile phones and landlines per 100 users, for selected countries. Overall, most of the countries included in the graph have more mobile phones subscribers than landlines.
Most European countries have high mobile phone use. The biggest users of mobile phones are the Italians, with 88 cell phones per 100 people. For example, Italy has twice as many mobile phones as landlines, with 88 mobiles per hundred people compared to 45 for landlines. Mobile phone use is low in Canada, with fewer than 40 phones per 100 people. Denmark is also unusual because it has slightly more landlines than mobile phones.
However, in some countries, the number of landlines is higher than the number of mobile phones. One example is the USA, where the number of mobiles, at 50 per 100 people, is much lower than the number of landlines, at almost 70 per hundred. A similar pattern can be seen in Canada. The highest number of landlines in the graph is in Denmark, with about 90 per 100 people. In contrast, the lowest figures for fixed lines are in Italy and the UK.
In conclusion, it seems that mobile phone use is higher in Europe than in North America.
(205 words)
1、凡本网站注明“来源好留学网”的所有作品,均为本网站合法拥有版权的作品,未经本网站授权,任何媒体、网站、个人不得转载、链接、转帖或以其他方式使用。
-
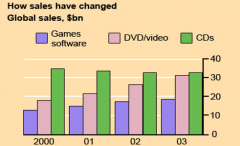 摘要:好留学网雅思频道这里和大家分享小作文柱状图的一篇范文,关于游戏软件等的销售信息,题目 是:The chart below gives information about global sales of games software, CDs and DVD or video. Task: The chart below gives information about glo
 -
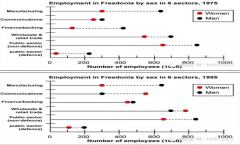 摘要:好留学网雅思频道这里和大家分享小作文柱状图的一篇范文,关于人口规律和未来趋势,题目是:The graphs below show the numbers of male and female workers in 1975 and 1995 in several employment sectors of the republic of Freedonia. Task: Th
 -
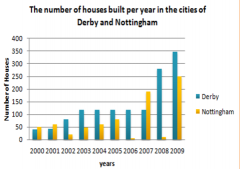 摘要:好留学网雅思频道这里和大家分享小作文柱状图的一篇范文,关于在两个城市每年在2009至2000年间建造的房屋数量,题目是:The number of houses built per year in two cities between 2000 and 2009. Task: The number of houses built per year in tw
 -
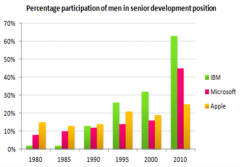 摘要:好留学网英语学习雅思频道这里和大家分享小作文柱状图的一篇范文,关于男性在高级发展中的百分比,题目是:The percentage participation of men in senior development between 1980 and 2010. Task:The percentage participation of men in senior