
雅思写作Task1小作文柱状图范文--英国不同时期技术服务产业的GDP
- 来源: 未知
- 发布时间: 2016-08-22 16:38
- 责编: 好留学网
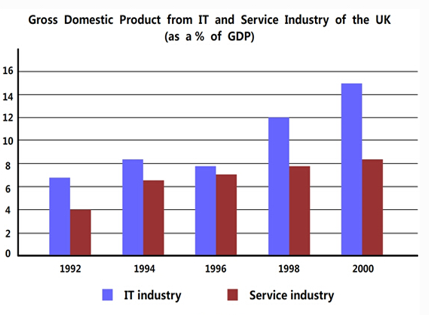
Task:GDP from the IT and Service Industry in the UK from 1992 to 2000.
思路解析:
1. 采用折线写法,重点描述数据的改变和趋势。
2. 注意一类数据的描述(起点,终点,交点,最高点,最低点)。
3. 注意描述线段的时候采用动作+程度的方式进行。
4. 分段原则为:每条线自成一段,即IT一段,Service一段。
5. 注意共性的描述:例如. 两者都在增长,且IT总是高于Service。
参考范文:
The bar chart illustrates the gross domestic product generated from the IT and Service Industry in the UK from 1992 to 2000. Overall, it can be seen that both increased as a percentage of GDP, but IT remained at a higher rate throughout this time.
In 1992, the data of IT was nearly 7%, much higher than that of Service. It then went up steadily to a little above 8% until 1994, when it began to decline. The next 2 years saw a slow decrease to 7.5%, followed by a sharp rise to 12% by 1998. Since then, the percentage of IT continued to soar and ended up with peaking at 15% by 2000, almost twice as high as Service industry.
The pattern of Service was different. During the first half period between 1992 and 1996, there was a steep increase to 7%, which was the closest to the level of IT industry in the same year. After that, this number began to remain stable and reached over 8% by 2000. Generally, the proportion of Service industry doubled in the past 8 years.
In conclusion, both IT and Service Industry played even-increasingly important roles in the contribution to GDP of UK. The percentage of IT went through a small fluctuation, while the number of Service had a straight rise.
(219 words)
1、凡本网站注明“来源好留学网”的所有作品,均为本网站合法拥有版权的作品,未经本网站授权,任何媒体、网站、个人不得转载、链接、转帖或以其他方式使用。
-
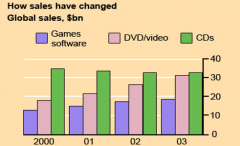 摘要:好留学网雅思频道这里和大家分享小作文柱状图的一篇范文,关于游戏软件等的销售信息,题目 是:The chart below gives information about global sales of games software, CDs and DVD or video. Task: The chart below gives information about glo
 -
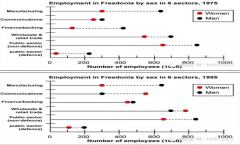 摘要:好留学网雅思频道这里和大家分享小作文柱状图的一篇范文,关于人口规律和未来趋势,题目是:The graphs below show the numbers of male and female workers in 1975 and 1995 in several employment sectors of the republic of Freedonia. Task: Th
 -
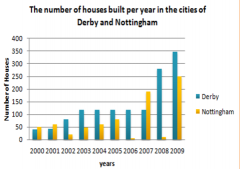 摘要:好留学网雅思频道这里和大家分享小作文柱状图的一篇范文,关于在两个城市每年在2009至2000年间建造的房屋数量,题目是:The number of houses built per year in two cities between 2000 and 2009. Task: The number of houses built per year in tw
 -
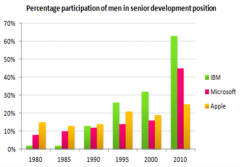 摘要:好留学网英语学习雅思频道这里和大家分享小作文柱状图的一篇范文,关于男性在高级发展中的百分比,题目是:The percentage participation of men in senior development between 1980 and 2010. Task:The percentage participation of men in senior