
雅思写作Task1小作文柱状图范文--两个城市建造的房屋数量
- 来源: 未知
- 发布时间: 2016-08-24 14:46
- 责编: 好留学网
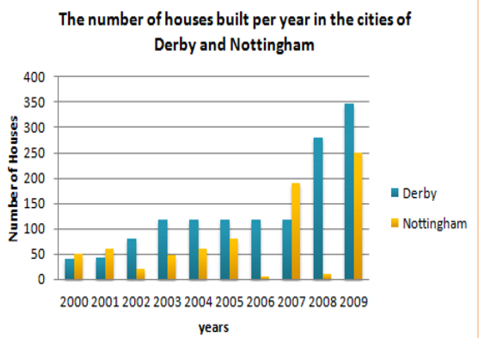
Task:The number of houses built per year in two cities between 2000 and 2009.
思路解析:
典型的动态柱状图,请参考折线写法 :
1. 注意极值的描述:最大值,最小值,交点等;
2. 明显的数据特征:如保持不变,剧烈上升或下跌等,需要呈现。
参考范文:
The bar chart describes the number of houses built in two neighboring cities, Derby and Nottingham, Between 2000 and 2009.
Overall, the number of houses that were erected in Derby exceeded upwards the quantity constructed in Nottingham. The trend for the former was decidedly upwards, with Derby experiencing a steady rise from 40 new houses in the first year, to just under 120 during the 2003. Over the next 4 years of decade, new houses construction in Derby remained constant at just under 120. This is in sharp contrast to the last two years when the number of houses that went up in Derby leapt, first to 280 and then to 350 houses.
Houses building in Nottingham, by comparison, was much more erratic. In the first two years of the decade, more houses were erected in Nottingham than in Derby. In 2002, however, construction declined to only 20. Over the next three years, houses numbers rose steadily, only to drop practically to zero in 2006. There was then a dramatic surge in 2007 with over 200 houses being built. While in 2008 saw house building in Nottingham plummeting to only 10, in 2009 the number of new houses rocketed to 270, a rise of more than 2600 % on the previous year.
(212 words)
1、凡本网站注明“来源好留学网”的所有作品,均为本网站合法拥有版权的作品,未经本网站授权,任何媒体、网站、个人不得转载、链接、转帖或以其他方式使用。
-
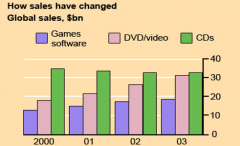 摘要:好留学网雅思频道这里和大家分享小作文柱状图的一篇范文,关于游戏软件等的销售信息,题目 是:The chart below gives information about global sales of games software, CDs and DVD or video. Task: The chart below gives information about glo
 -
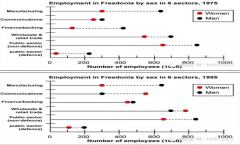 摘要:好留学网雅思频道这里和大家分享小作文柱状图的一篇范文,关于人口规律和未来趋势,题目是:The graphs below show the numbers of male and female workers in 1975 and 1995 in several employment sectors of the republic of Freedonia. Task: Th
 -
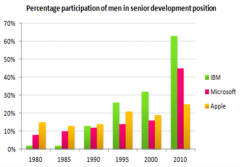 摘要:好留学网英语学习雅思频道这里和大家分享小作文柱状图的一篇范文,关于男性在高级发展中的百分比,题目是:The percentage participation of men in senior development between 1980 and 2010. Task:The percentage participation of men in senior
 -
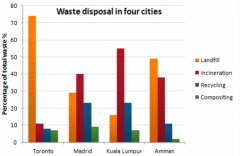 摘要:好留学网英语学习雅思频道这里和大家分享小作文柱状图的一篇范文,关于四个城市的垃圾处理方法,题目是:Different methods of waste disposal in four cities. Task: Different methods of waste disposal in four cities. 思路解析: 1. 该图的分组...